3.17 Pandas
Along with numpy, pandas is one of the most common Python libraries for working with tabular data. Where numpy is optimized for working for matrices of numerical data and rapid mathematical operations, pandas is designed for manipulating and reshaping tables that contain multiple data types. As with other packages, it is conventional to import pandas with a shortened name, as:
pd.read_csv()The most important data type that we use in pandas is the DataFrame, which is a two-dimensional data structure. A typical DataFrame looks like this:

Note the overall organization of this DataFrame:
- In the leftmost column, we have the indices, which are the row names of our DataFrame. Here, the indices are the integer row numbers.
- In the top row, we have the column names of our dataframe.
Also note that the Species column consists of strings, while the other columns consist of numeric values. Datasets that mix data types like this are where pandas is best used.
3.17.1 Importing Data
The key function we will use to import data is pd.read_csv(). The only required argument to this function is the name of the file you are trying to import, and by default pandas will do a lot ot infer the appropriate settings to correctly read in your data. However, it doesn’t always get things right, especially for more complicated datasets. Some useful arguments that can control how your file is imported are:
sep- a string which separates values. By default,,.header- the row number in your data that contains the header. The header is used to infer column names.names- this argument allows you to explicitly provide the names of your columnsindex_col- the column which provides the indexusecols- if you only want to read in a subset of your data, this argument lets you specify which columns to use
The iris dataset pictured above is nicely formatted for import with pandas; it can be read in with a simple comand of:
iris = pd.read_csv('iris.csv')3.17.2 Subsetting Data
To subset pandas DataFrames, we use the syntax: <DataFrameName>.loc[<rows>, <columns>]
For example, if we want to find the petal width of the plant in the fifth row, we use the following notation:
iris.loc[4, 'Petal.Width']
As with lists, we can use a colon to indicate a range of values that we want to subset:
iris.loc[18:22, 'Sepal.Width']
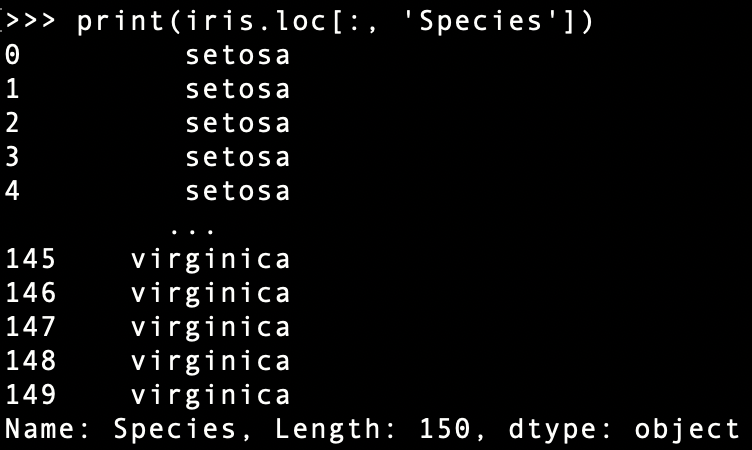
Also as with lists, leaving one side of the colon blank indicates that we want to index to the start/end of the data structure. Therefore, the following notation extracts an entire column:
iris.loc[:, 'Species']
3.17.3 Boolean Indexing
pandas DataFrames present a new way of subsetting data: Boolean indexing. Boolean indexing refers to taking a vector of True or False values that is equal in size to one of the dimensions of your DataFrame and subsetting your data to only elements in True positions.
For example: let’s say that we want to subset our data just to the Virginica species.
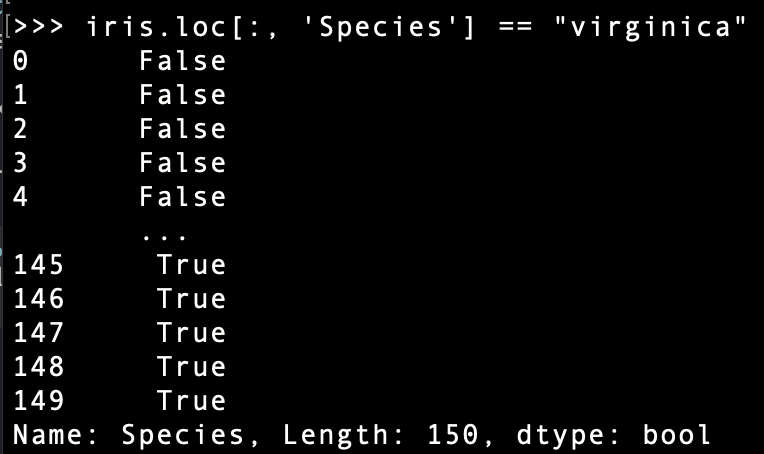
We can first check which rows in the Species column contain the string virginica:
iris.loc[:, 'Species'] == 'virginica' 
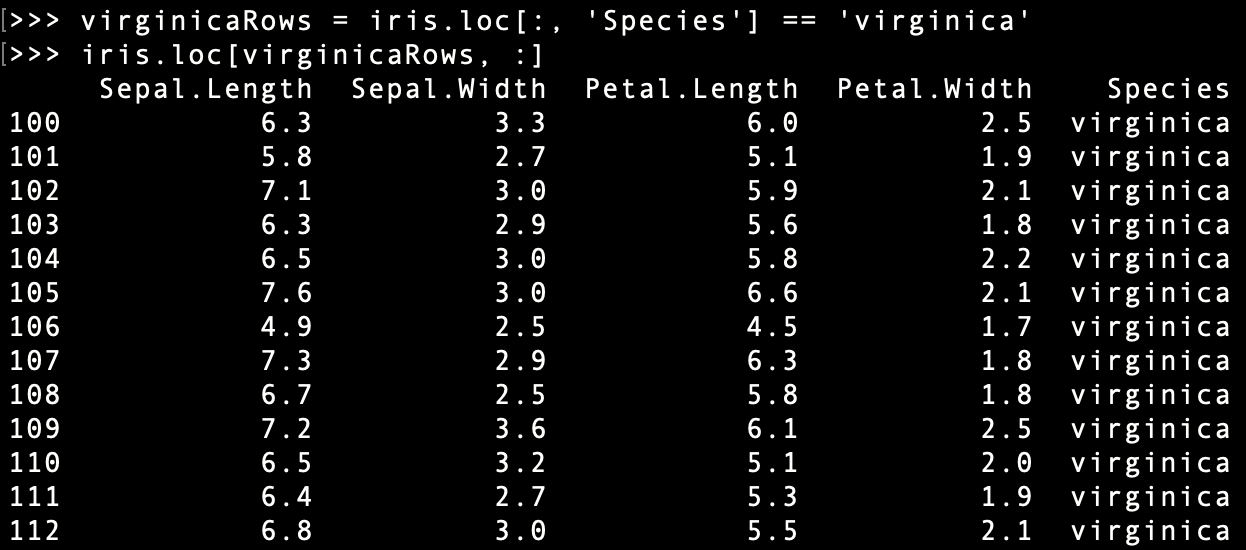
We can now subset this just rows where the above is true like so:
iris.loc[iris.loc[:, 'Species'] == 'virginica', :]or if the above looks cumbersome and hard to read (which it is), you can break it up into multiple rows for legibility:
virginicaRows = iris.loc[:, 'Species'] == 'virginica'
iris.loc[virginicaRows, :]
3.17.4 Adding Columns
We can add a new column to our DataFrame by using the following notation:
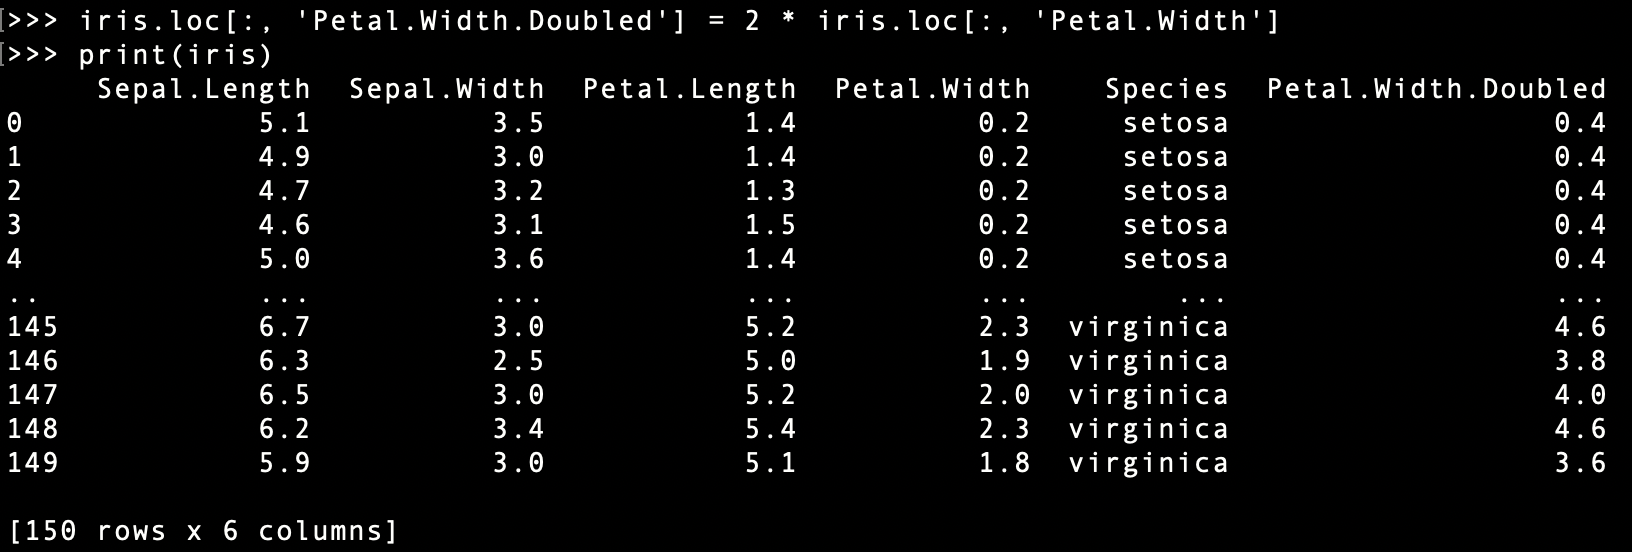
<dataFrame>.loc[:, <columnName>] = <data><data> can be a list of values that you provide, or it can be a modification of an existing column. For example, if we wanted to add double the petal width, we could do so as such:
iris.loc[:, 'Petal.Width.Doubled'] = 2 * iris.loc[:, 'Petal.Width']
print(iris)
3.17.5 Adding Rows
We can use a similar notation to add a new row. Here, we instead provide pandas with a new index:
iris.loc[9876535123, :] = [5.6, 3.2, 1.1, 0.3, 'larch', 0.6]
print(iris)